CO2 Sensor App

Using this CO2 Sensor App, you can read an EE895 CO2 sensor connected to the Raspberry Pi using I2C.
Our sister company, buyzero.de, offers a plug & play EE895 CO2 Sensor breakout module, which you can connect directly to the Raspberry Pi header.
The EE895 does not need to be calibrated with fresh air every day or week! It’s a high quality sensor by an Austrian company, E+E Electronics.
Three different measurement values are supported:
- Air pressure
- Air temperature
- CO2 concentration
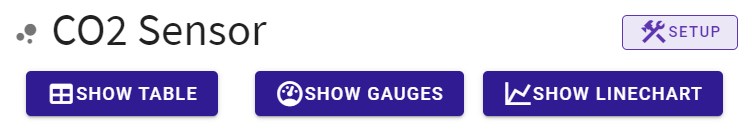
The app has three different views, allowing you to visualize the data the way you want:

Installation and Setup
The first thing to do is power your Raspberry Pi off and connect the EE895 module. Refer to your vendor’s instructions how to do this.
After you’ve attached the EE895 module, you can turn your Raspberry Pi back on.
If you haven’t, you need to install PiCockpit on your Raspberry Pi.
After that, open the CO2 Sensor app, and click on the button that reads “SETUP” at the top right of the page:
Enable the EE895 sensor by clicking on the “enable sensor” toggle.
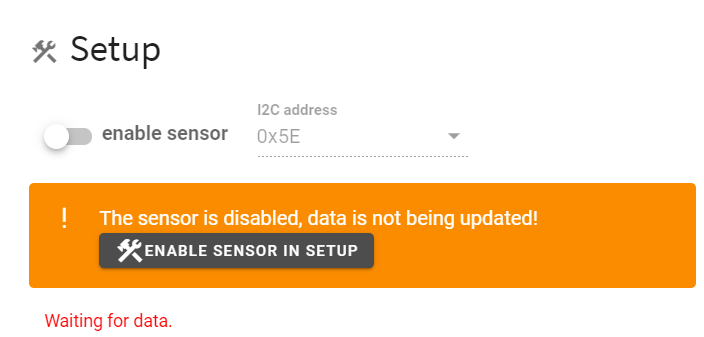
If the sensor can be reached, the message below will update to “Data received: …” with a timestamp of the most recent data packet received.
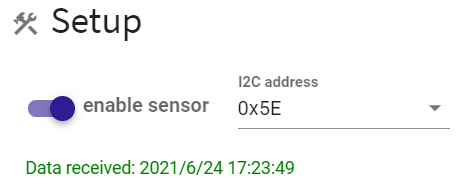
Once this is enabled, your EE895 sensor is ready to go.
Please note that data packets will be sent every second, but the sensor itself (by default) measures the air roughly every 12 seconds. Therefore, data will update gradually.
Now, let me go through what you can do with the CO2 Sensor App.
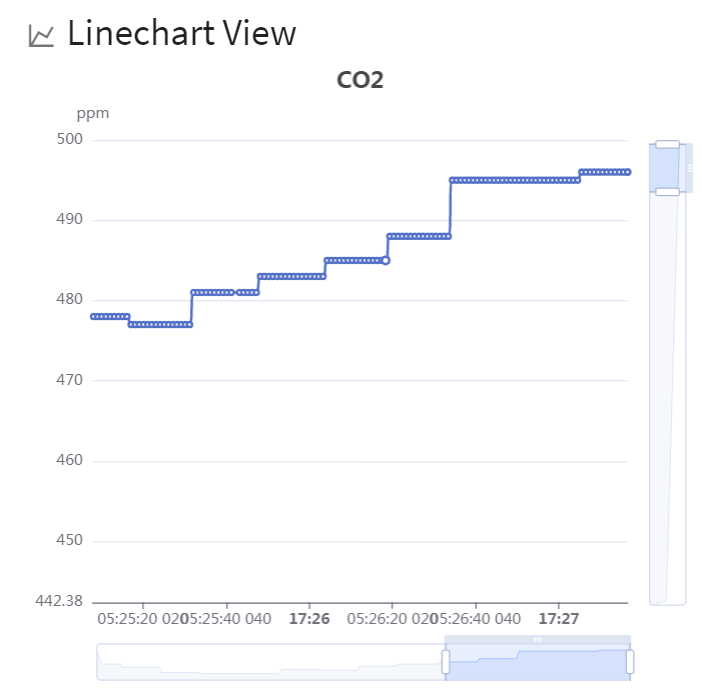
Show Linechart
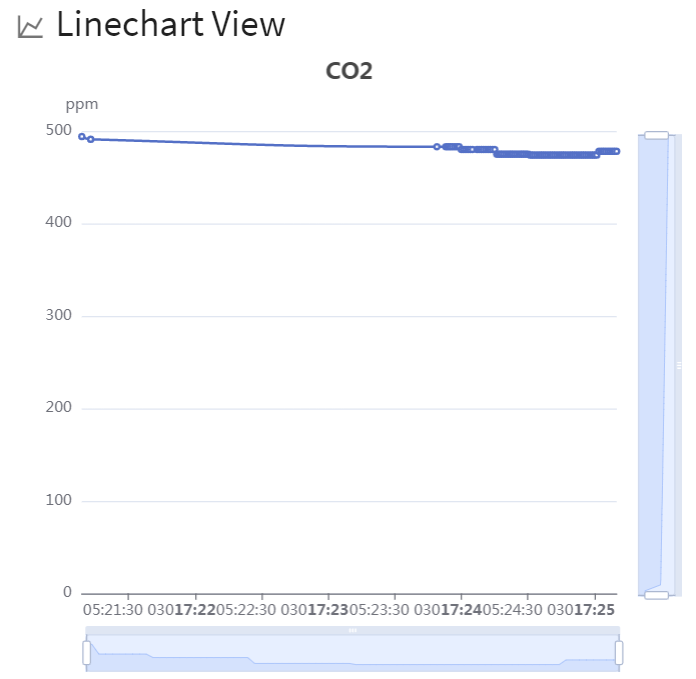
Use the “show me” buttons to select the value you would like to see.
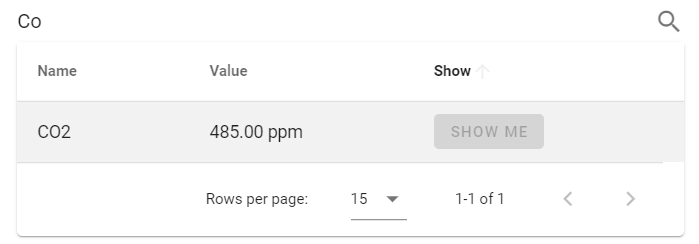
Use the search to focus on just the values you want.
The elements at the bottom and right next to the chart allow you to drill down into particular data areas and value areas which you want to investigate. You can use them to zoom into one of the charts:
Gauge View
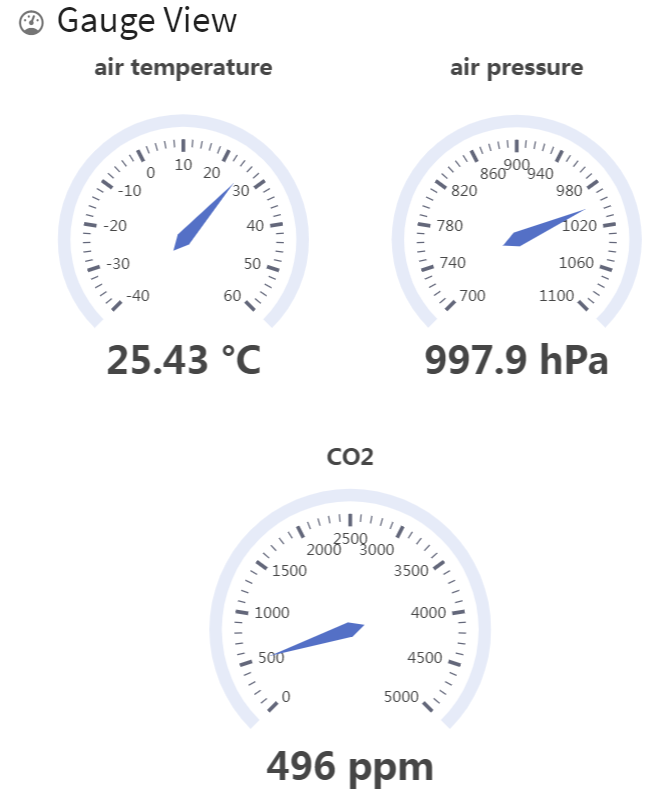
In the Gauge view, you will get a clean overview with gauges to display the current values. Here you can monitor the following values:
- Air temperature (in °C)
- Air pressure (in hPa)
- CO2 concentration (in ppm)
The gauge view also contains a table with the data at the bottom.
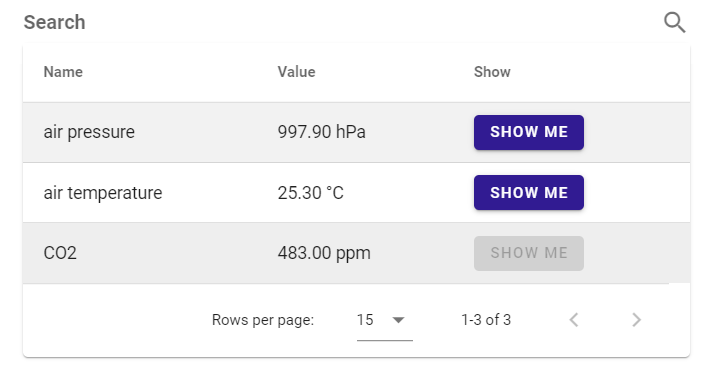
Table View
If you simply want a quick, tabular overview of the data, you can click on the “SHOW TABLE” button:
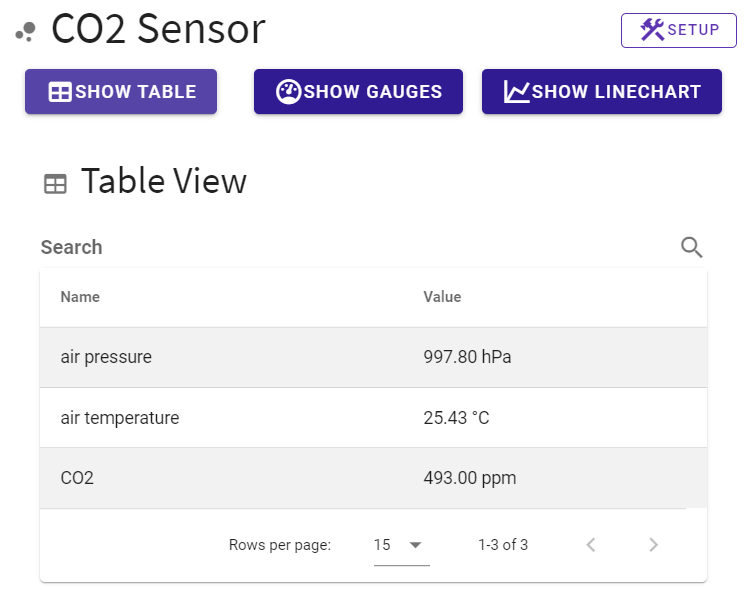
You can also use the search feature to narrow down the view to just the items you want:
FAQ
How long will the data remain in the C02 Sensor App?
The historical data values will only be preserved in your web browser while the app is open.
Once you navigate away, or close the tab, the data will be lost.
Does the C02 Sensor App run on UART?
While the EE895 also supports UART operation, the PiCockpit app only supports I2C operation.
Does this app also support the Winsen MH-Z19C? Or the Winsen MH-Z19B?
No, PiCockpit only supports the EE895 sensor. If you would like to receive support for other sensors, please contact us and let us know.
Where can I obtain the EE895?
Our sister company, buyzero.de, offers an EE895 breakout board that provides plug & play attachment on the Raspberry Pi GPIO header.
Conclusion
If you have any questions or encounter any issues, do not hesitate to contact us.
We’ll help you get the PiCockpit CO2 Sensor App up and running!