PiStats

PiStats allows you to view live Raspberry Pi hardware usage statistics in a simple web interface.
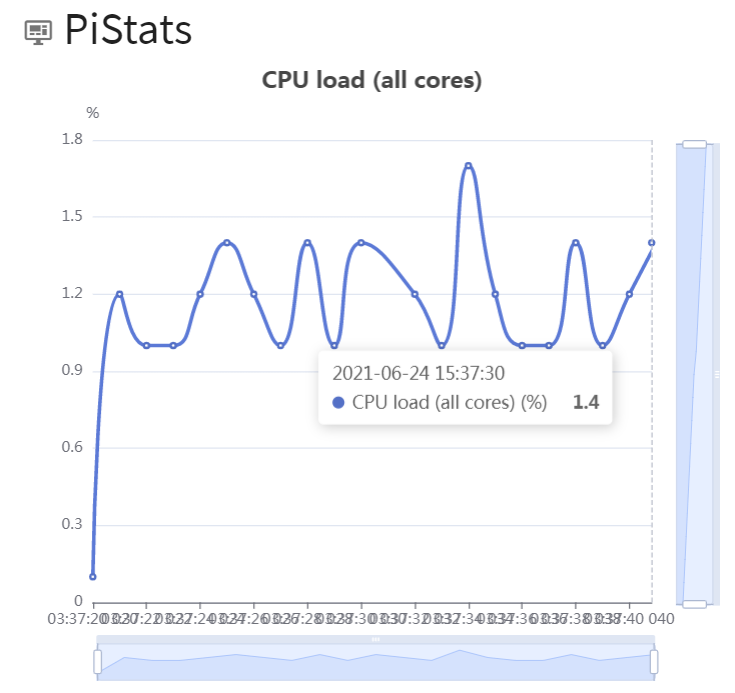
Here are some examples:


Monitoring with PiStats
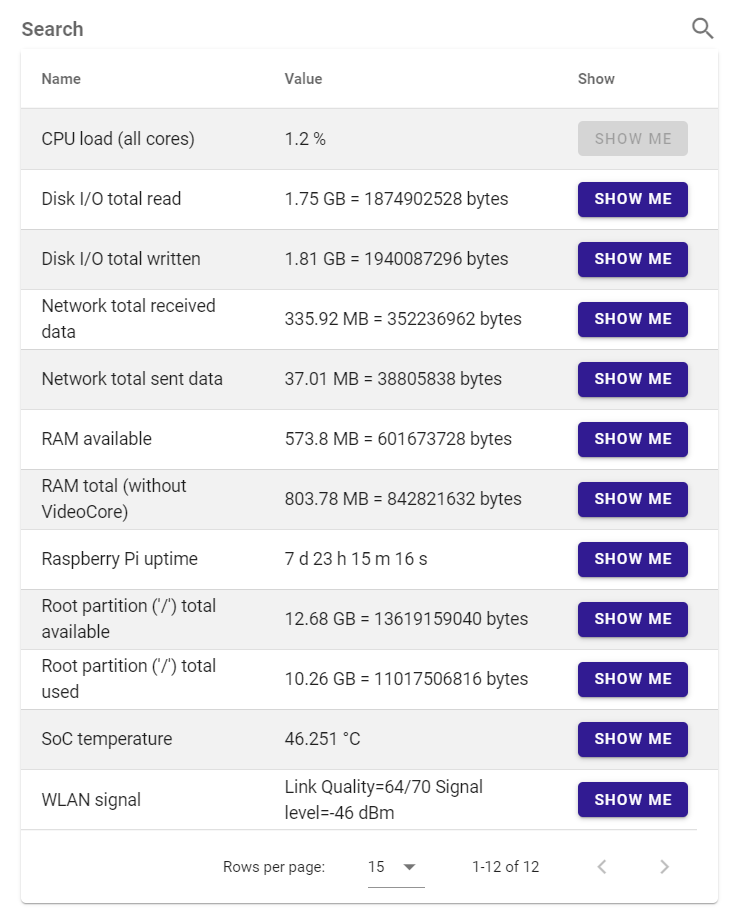
The values will be refreshed once every second. Here is a list of the data you can see with PiStats:
- CPU load (across all cores)
- Disk I/O total read (showing you a human readable sum and the value in bytes)
- Disk I/O total written
- Network total received data
- Network total sent data
- RAM available
- RAM total (without VideoCore) – this value will reflect the RAM which is available to your operating system (e.g. Raspberry Pi OS)
- Raspberry Pi uptime – how long has your Raspberry Pi been running since the last reboot or power up?
- Root partition (“/”) total available – how much free space is left on your main partition?
- Root partition (“/”) total used – how much space is used? (increases here should also reflect in Disk I/O total written)
- SoC temperature – shows the Raspberry Pi CPU temperature
- WLAN signal – shows link quality and WiFi signal level in dBm
Visualizing the Statistics
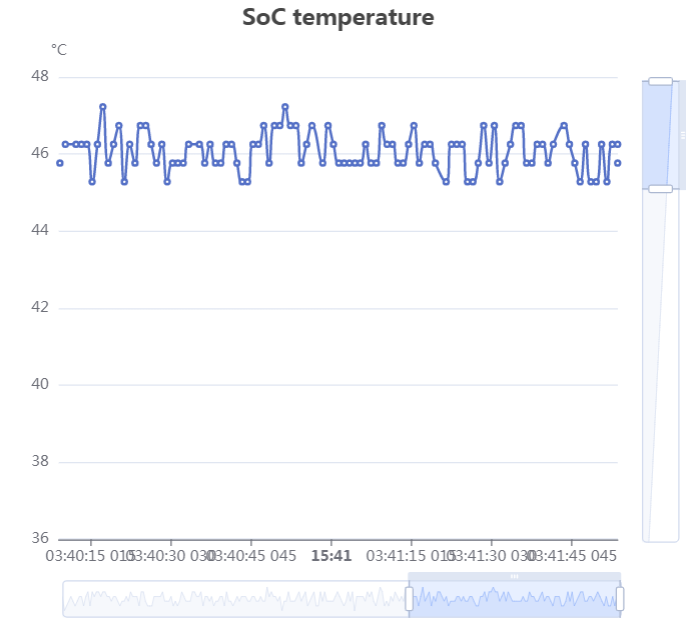
Click on the “Show me” button beside the statistic you’re interested in, for example the SoC temperature:


You can drill down into particular times and focus on the relevant part of the measurement scala using the elements at the bottom and the right (see screenshot).
Note: you will only get historical data for the time the app is open, as it is cached in your web browser.
When you navigate away, the data will be lost.
Search
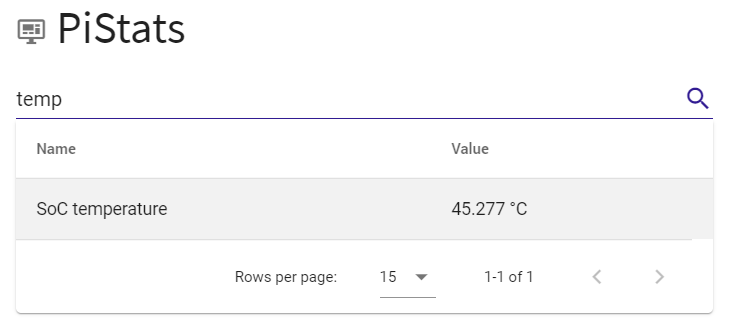
A useful feature built into version 2.0 of PiCockpit’s PiStats is the search, which allows you to focus on the entry you are most interested in.
Let’s say, you want to monitor the Raspberry Pi’s CPU temperature:

Conclusion
If you have any questions or run into any issues, do not hesitate to contact us and we’ll help you get PiStats up and running!