PiDoctor

To monitor your Raspberry Pi system’s health, you can use PiCockpit’s app PiDoctor. PiDoctor will also allow you to learn many details about your Raspberry Pi, including where it was manufactured, how much RAM it has, and so on.
Use PiDoctor to Diagnose your Raspberry Pi
Running all Raspberry Pi Health Tests
PiDoctor, as the other PiCockpit apps is included for free for up to 5 Raspberry Pis.
- Log into PiCockpit
- Open the My Raspberry Pis page to access your Raspberry Pi overview
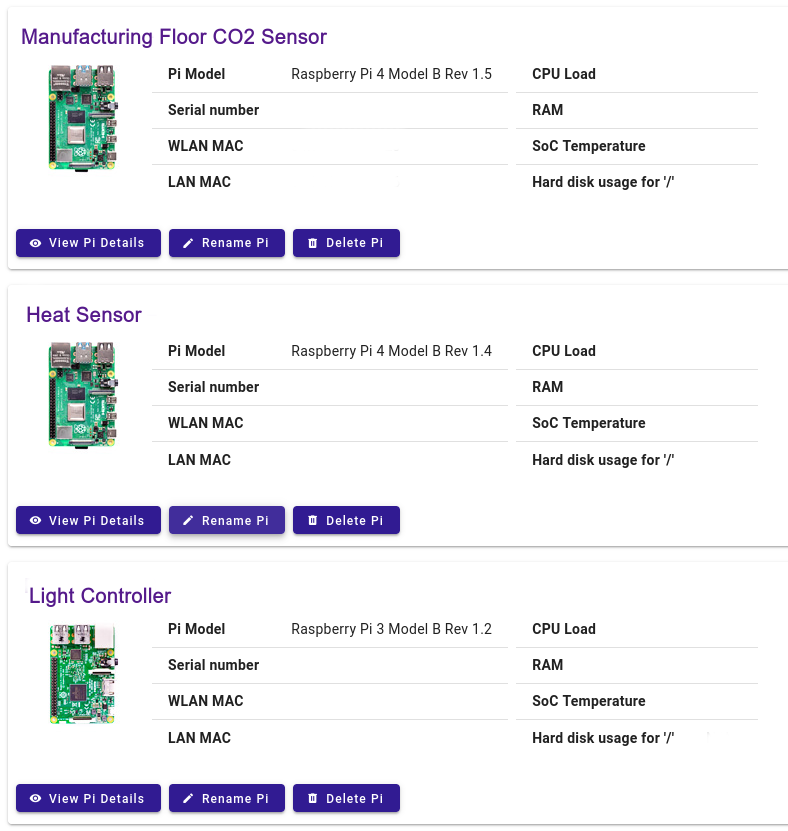
- Click on the Raspberry Pi you want to diagnose
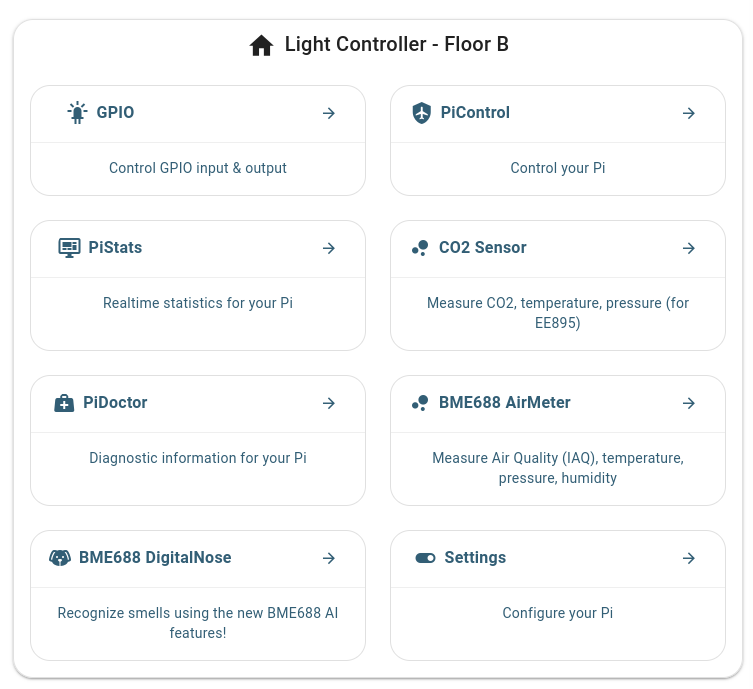
4. Click on PiDoctor
You will see the following screen:
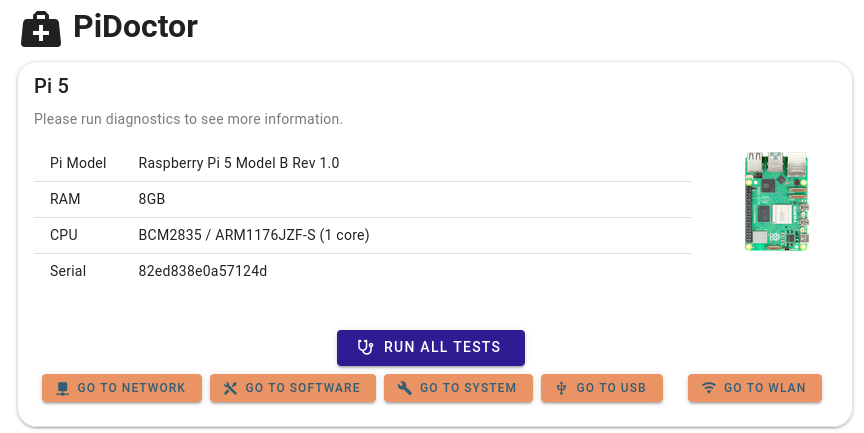
5. Click on Run all Tests
You can now scroll down through the page to see the test results for the individual modules, or click on any of the quick access buttons to jump to the system test module you’re interested in:
Health Check Modules
Each module has a button at the bottom, which allows you to run just the tests of this module.
There also is an “auto reload” toggle switch in the upper corner, which allows you to have the test run automatically each 10 seconds.
This is useful for continuous monitoring of changes.
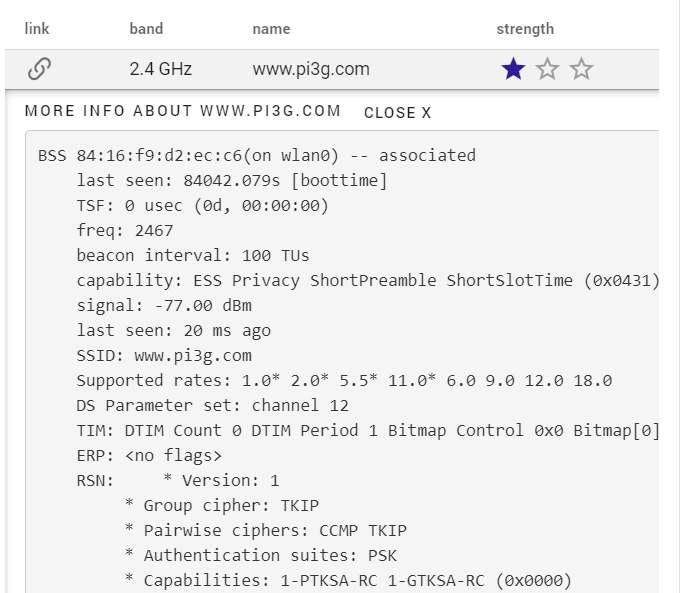
The WLAN Module
The WLAN module allows you to scan the WiFi networks in your Raspberry Pi’s neighbourhood, determine which one it is linked to, and the strength. By clicking on details, you’ll be able to see the full technical details of the network:
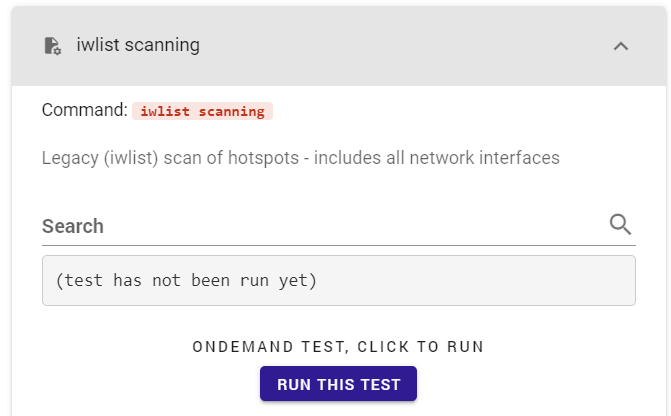
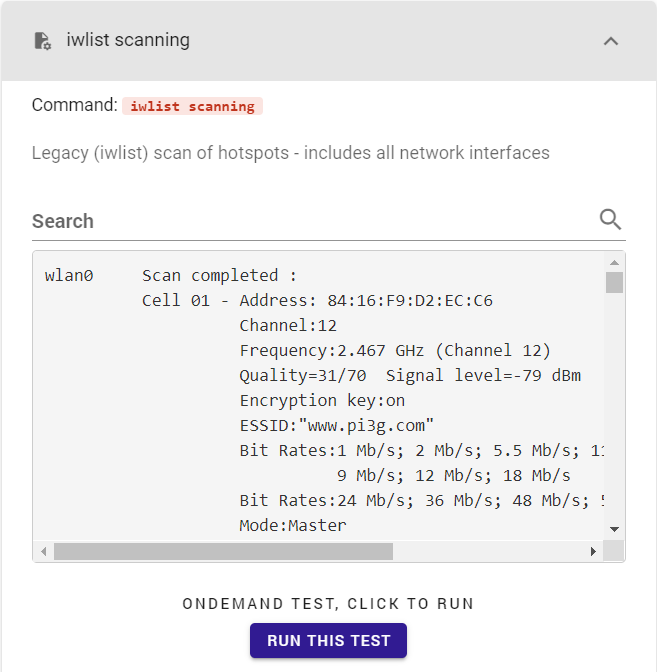
In the “advanced information” section, many additional commands are present which you can see the output of. Some of them will only be run if you click “Run this test”:
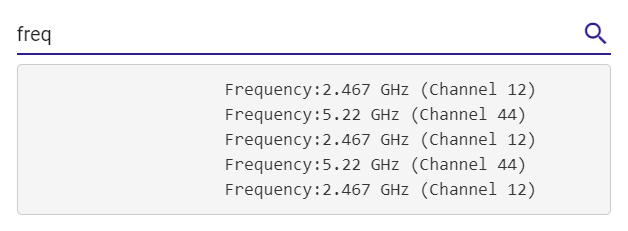
The search allows you to quickly find matching lines in the output:
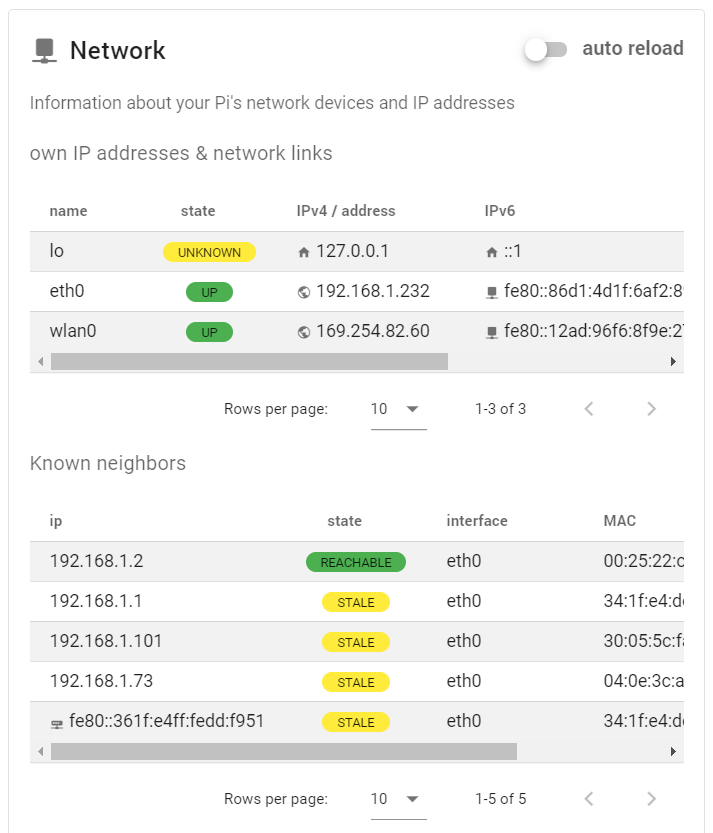
The Network Module
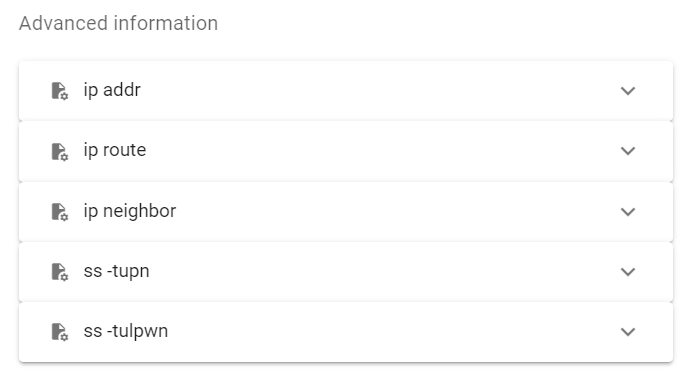
The network module shows you your Raspberry Pi’s current IP addresses, network links, and the known neighbors.
Some additional information is available in the advanced information section:
The System Module
System is one of the most powerful and extensive Raspberry Pi system test modules in PiCockpit.
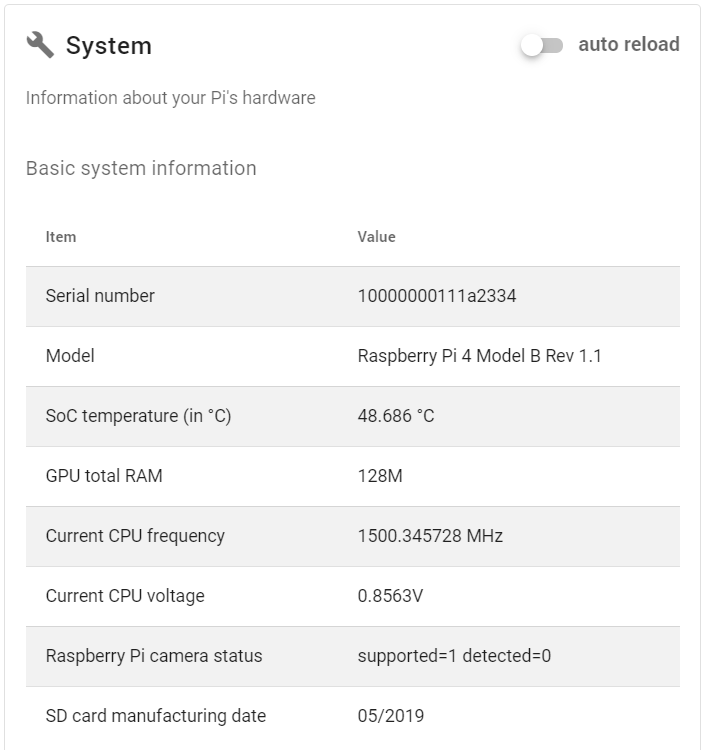
The first part, Basic system information, shows you some important overview information:
- The Raspberry Pi serial number
- The Raspberry Pi model
- The SoC temperature of your Raspberry Pi (monitor the CPU temperature using this, or use PiStats App to see updates every second)
- The GPU RAM
- The current CPU frequency (this is useful if you are overclocking your Raspberry Pi)
- The current CPU voltage
- The status for the Raspberry Pi camera – diagnose camera issues to see if the Raspberry Pi supports and detects the camera
- The SD card manufacturing date
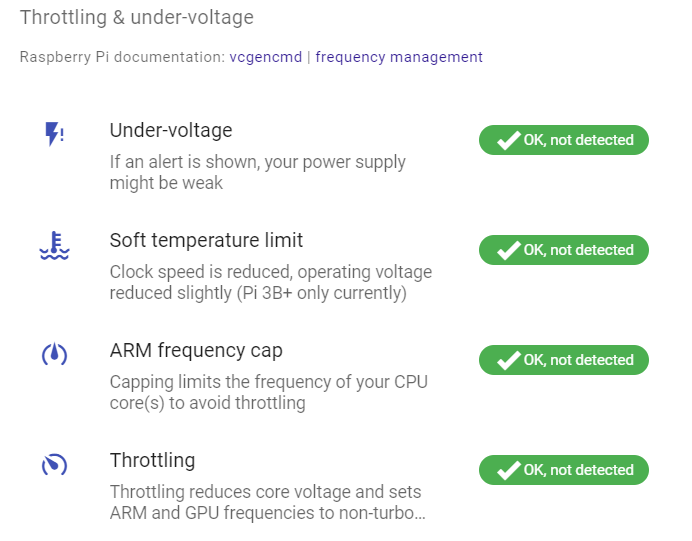
Using the next part, Throttling & under-voltage, you can diagnose vital information about your Raspberry Pi:
- Is your Pi power supply strong enough?
- Is your Raspberry Pi running too hot?
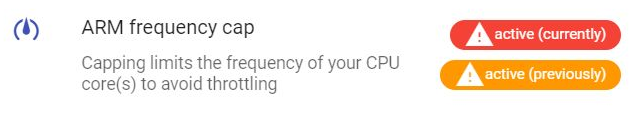
In case there are issues (currently or previously), PiCockpit will show these here. For example, for the ARM frequency cap being triggered:
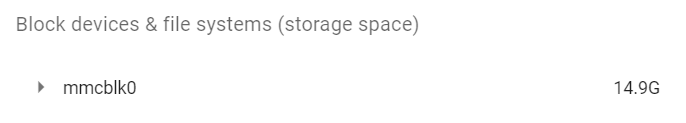
The Block devices & files systems (storage space) module is collapsed initially, but can be expanded by clicking on the arrow:
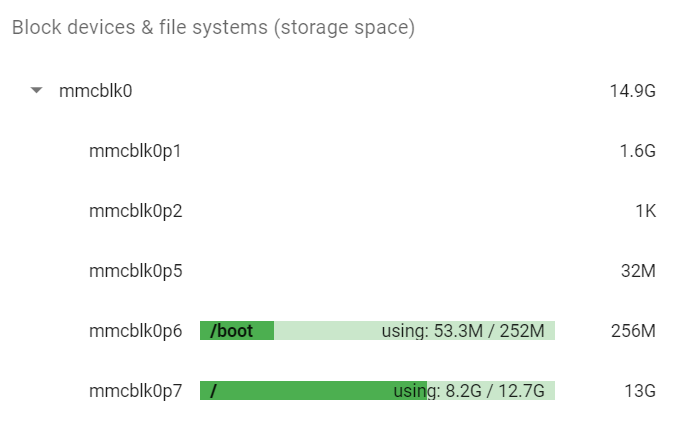
You will be able to see all partitions, their size, and the used space for mounted partitions. This will allow you to determine if you are running out of space on your root partition on your Raspberry Pi.
The root partition is always mounted under /.
In our case, that is the last partition: mmcblk0p7.
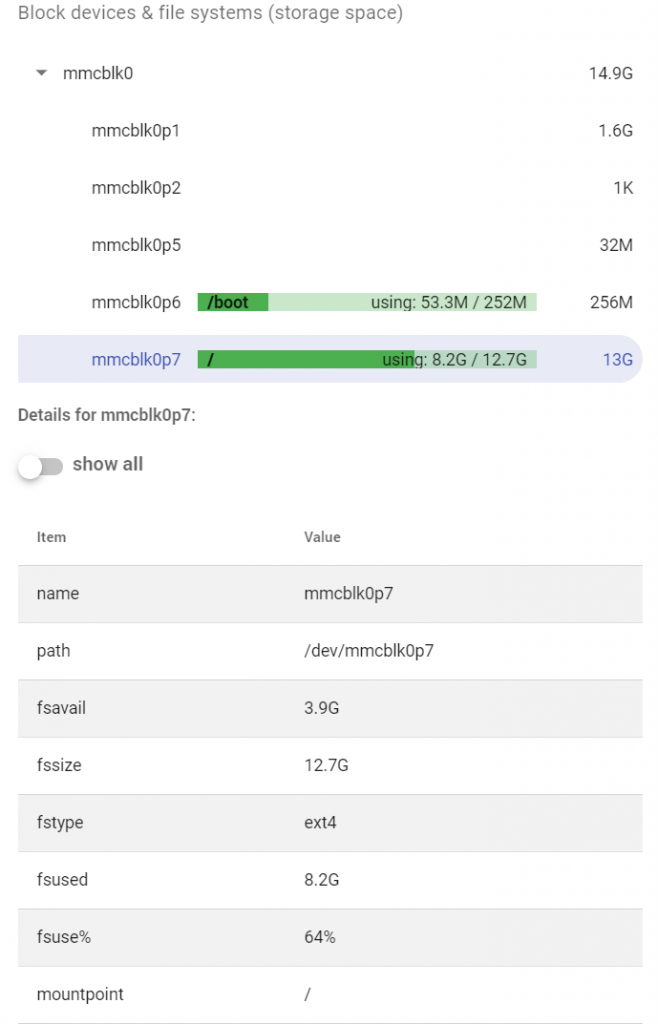
Click on any entry to see even more details:
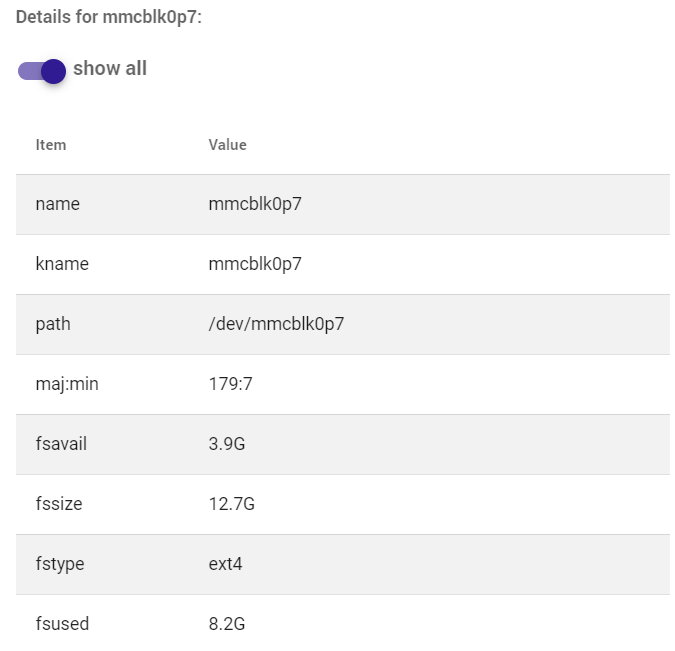
Here you could click the show all toggle to show even more details (probably for interest only for people wanting to dive deep into technical details):
Using this section you can diagnose which filesystem (fstype) a partition has, which /dev/ path it has (for example /dev/mmcblk0p1), it’s mountpoint, size, usage and label amongst other information.
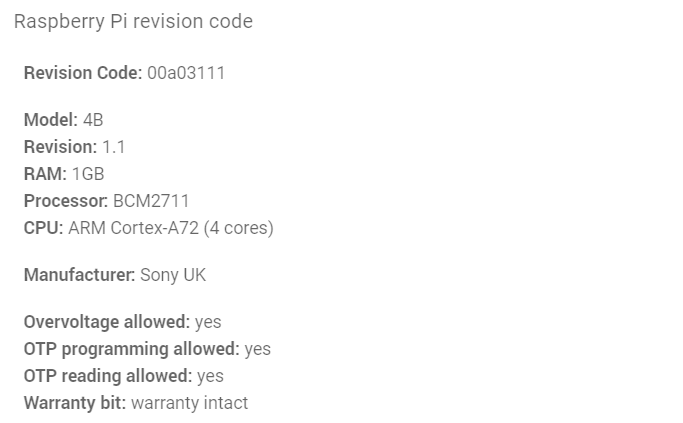
There are two variants of Raspberry Pi revision codes, PiCockpit can handle both the old variant and the new variant. The new-style revision code gives more details:
- The Raspberry Pi model
- The Raspberry Pi model revision
- The RAM of your Raspberry Pi
- The Raspberry Pi processor (the SoC)
- The Raspberry Pi CPU
- The manufacturer
There are also some additional flags you can see in PiDoctor’s System / Raspberry Pi revision code part:
- Overvoltage allowed
- OTP programming allowed
- OTP reading allowed
- Warranty bit
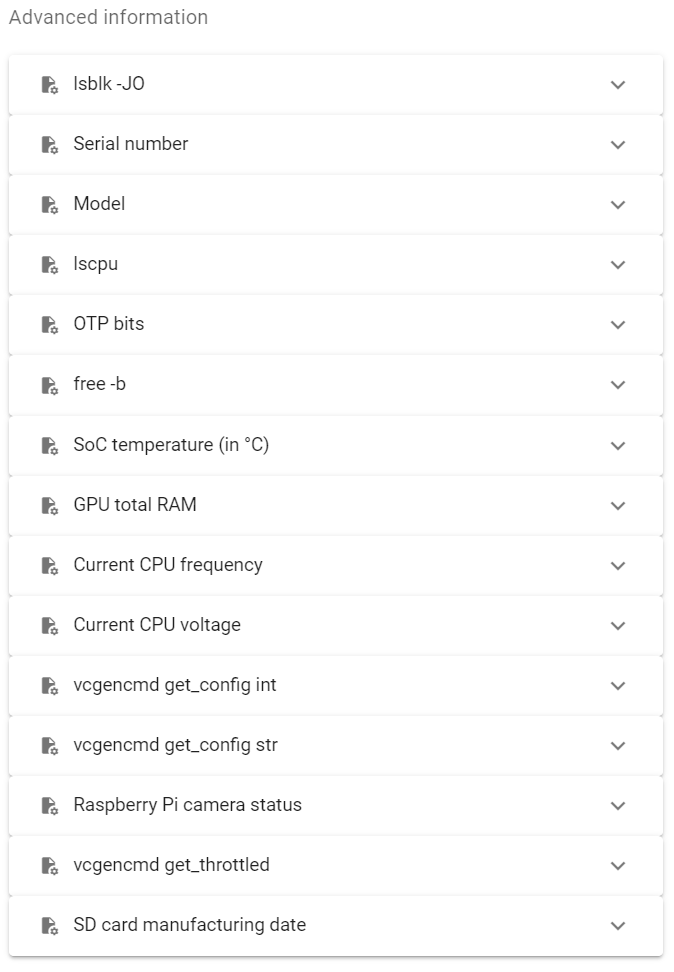
The advanced information includes additional diagnostics, presented in text form:
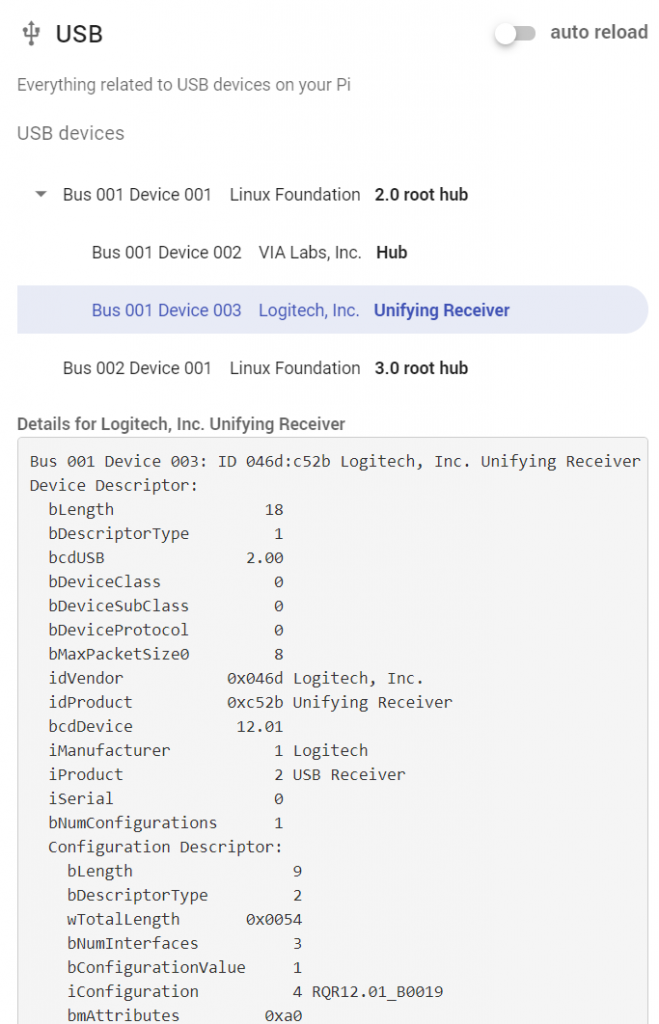
The USB Module
The PiDoctor USB module will allow you to monitor which USB devices are attached to your Raspberry Pi and retrieve details about them:
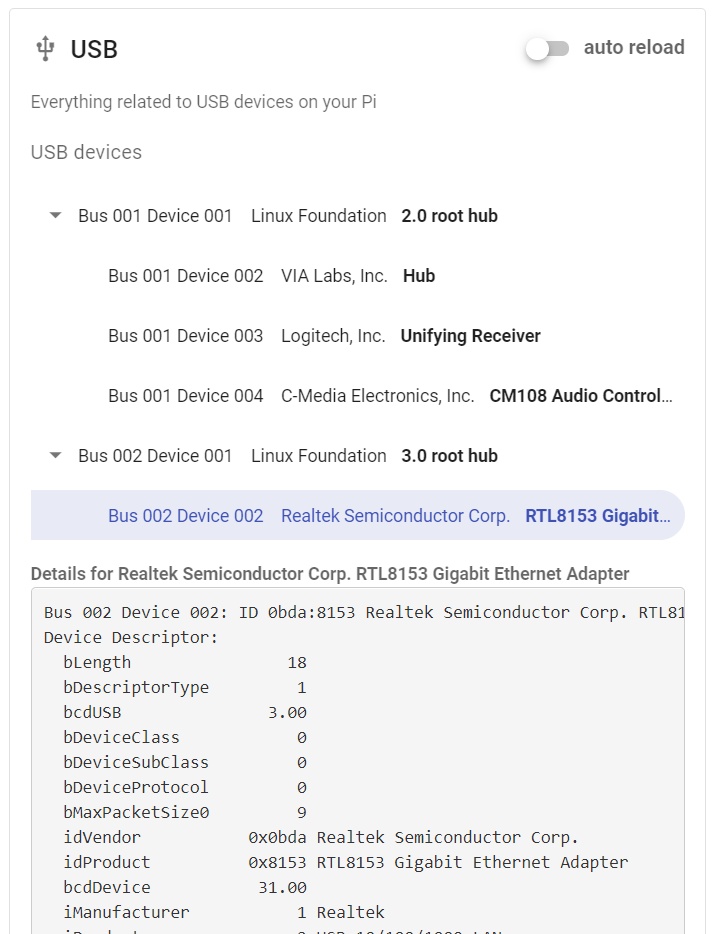
Click on the arrow(s) to expand the hierarchy of USB devices:
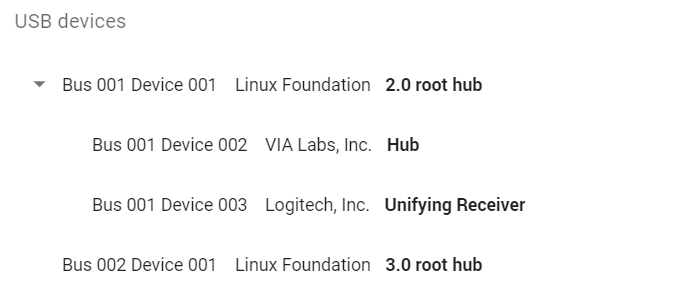
Click on the device you are interested in to get more details:
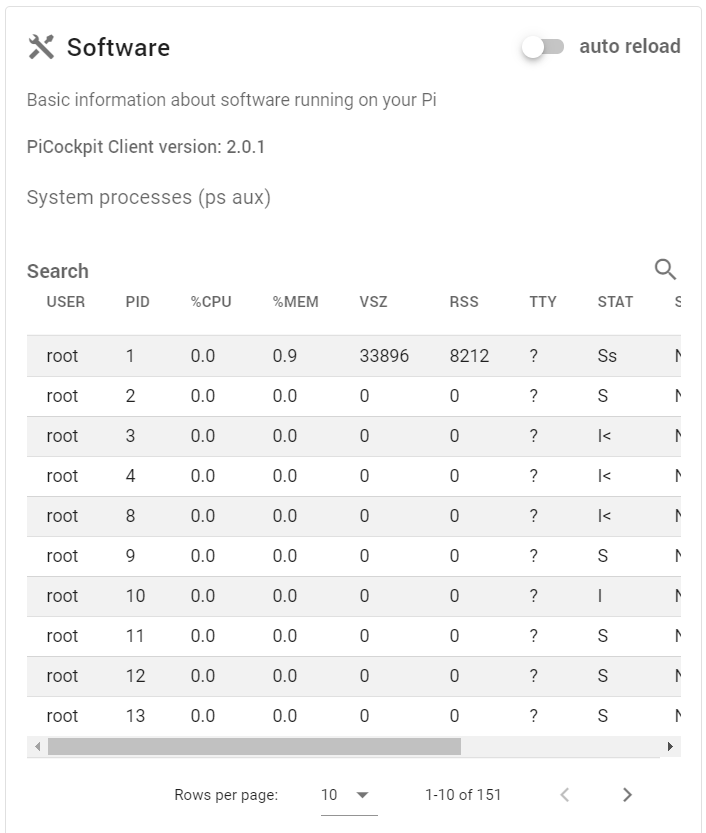
The Software Module
The software module in PiDoctor will show you which verison of the PiCockpit Client you have. It is important to keep the PiCockpit Client up-to-date (use PiControl to update it from within PiCockpit’s web interface).
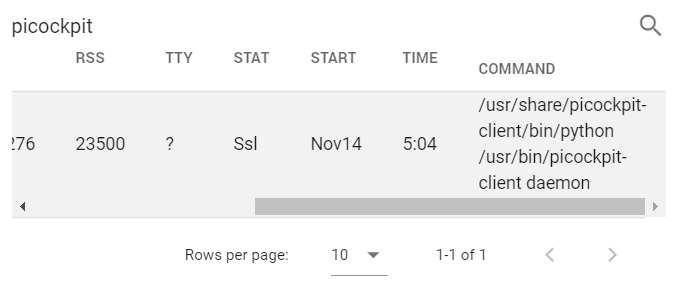
And also, it will allow you to see the currently running processes (ps aux output) and search them by name:
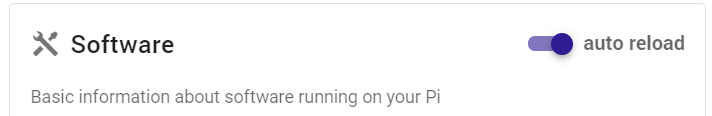
Note that these results and the list of processes are not updated live. If you want them to be periodically refreshed, click on auto reload (this will reload them every 10 seconds):
There are some additional tests in advanced information:
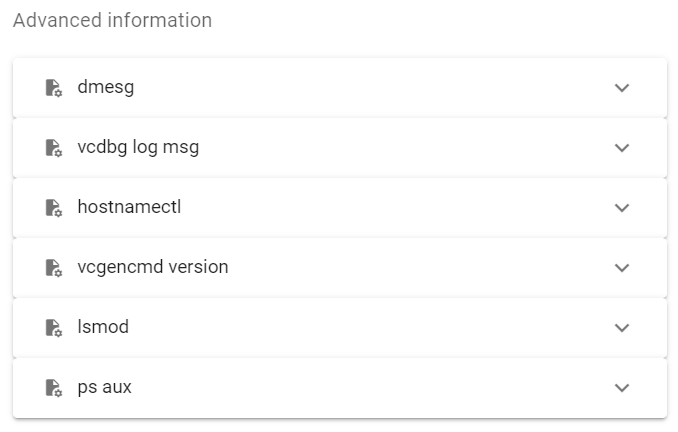
You can access the output of the following commands here:
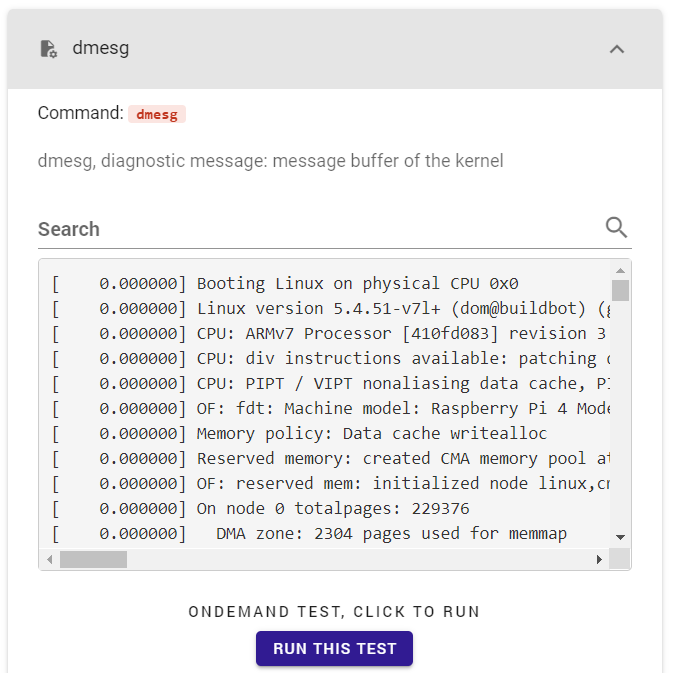
- dmesg (Kernel message buffer)
- vcdbg log msg
- hostnamectl
- vcgencmd version
- lsmod (loaded kernel modules)
- ps aux (raw output)
You’ll be able to search through the results quickly, by entering the text you are looking for in the search above the output of the particular advanced information output you are interested in:
Disabling tests in PiDoctor
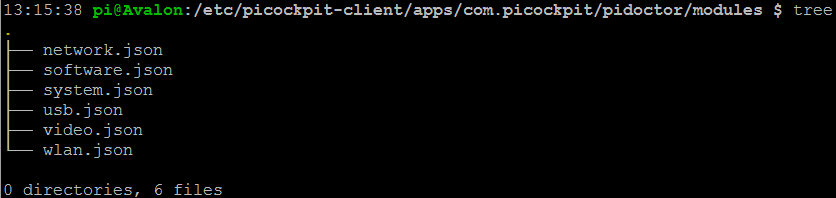
If you want to disable tests, for security reasons, for example, you should remove the corresponding .json definition files from
/etc/picockpit-client/apps/com.picockpit/pidoctor/modules
Adding custom tests to PiDoctor
Adding custom tests is possible by adding additional .JSON module definitions. Look at the examples in the code which are present, be sure to define your own unique handles, and restart the PiCockpit Client.
Note, the custom tests will be shown as “Advanced information”. If you require your own customisation for a particular feature, please get in touch with us for a quote.
FAQ
PiDoctor is not showing up under additional tools, how do I access it?
PiDoctor has been merged into PiCockpit. Please install the PiCockpit Client on your Raspberry Pi, and access the PiDoctor App.
The classic, stand-alone PiDoctor version has been discontinued.
How can I download the EDID?
Currently extracting the EDID is not implemented in the new PiDoctor App. A lot of output you would want the EDID for is implemented though, please have a look at the screenshots above.
For instructions, how to read your monitor’s EDID on a Raspberry Pi manually, click here.
Can I download the former stand-alone version of PiDoctor?
You can download the last legacy stand-alone version of PiDoctor here (Version 2.1.18).
The software is provided as is, without any warranty.
With the legacy version, you can use the same SD card with many different Pis in sequence – it will create a .JSON log file for every Pi you’ve tested, extracting different data.
This blog post might come in handy as notes how to use PiDoctor legacy.
Download links:
- pidoctor-2.1.18.tar.gz (109 MB)
- readme+hashes.txt (1.8 kB)
- pidoctor-2.1.18.img.zip (128 MB) (this is what you want if you want to write an image to an SD card)
- pidoctor-2.1.18.zip (109 MB)
These download links contain the same base software, based on Alpine Linux – in different formats for your convenience. When in doubt, go for the .img.zip and write the image using tools such as Etcher.
Please note the following limitations:
- The legacy PiDoctor version does not support the Pi 4 or Pi 400 (the new version of PiDoctor, as part of the PiCockpit platform supports all Raspberry Pis and will continue to be updated).
- The legacy version cannot be installed on an existing operating system – you need to put it on it’s own SD card.
- The online evaluation tool has been discontinued, so you will have to look at the raw .JSON file yourself – unfortunately this file format is not compatible with the new PiCockpit platform v2.
Conclusion
If you have any questions or run into any issues, do not hesitate to contact us and we’ll help you get PiDoctor up and running!