Sneak Peek into PiCockpit v2.1
Behind the scenes, we have been working on PiCockpit v2.1 for a while now.
There is a cool new feature coming for PiStats, but this will be revealed when PiCockpit v2.1 is ready 🙂
For now a sneak preview into one of the two new apps (“BME688 Air Quality Meter” and “CO2 Sensor”) for the upcoming release:
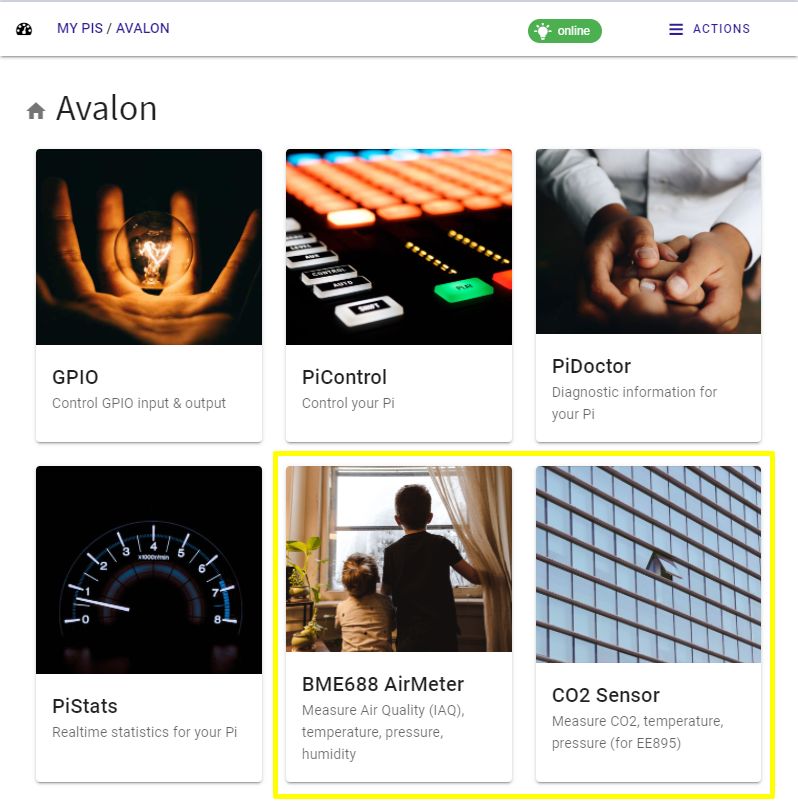
CO2 Sensor
We have created a Raspberry Pi (normal Pis and Pico) breakout board for a high quality CO2 sensor from E+E Electronics.
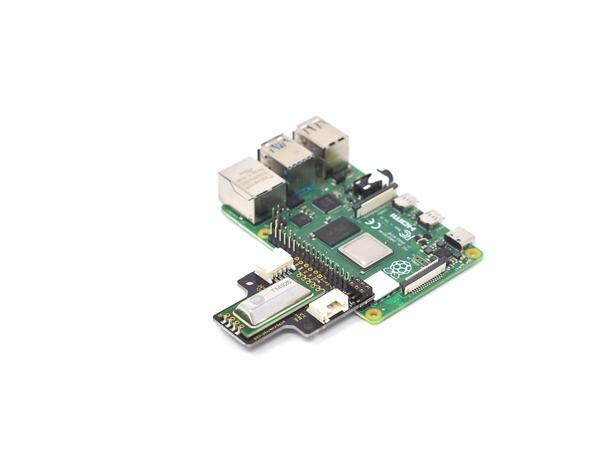
Shut down your Pi, and attach the CO2 Sensor board as shown. Power your Pi up.
Note: this app is not compatible with other CO2 sensors, as it was specifically developed for this EE895 CO2 sensor. It is of course free to use, for up to 5 Pis (and thus up to 5 CO2 sensors 🙂
Note: you will only be able to use the new apps, if you update to picockpit-client Version 2.1.0 or higher – as soon as it becomes available, of course.
When you click on the CO2 Sensor app, you’ll see this screen at first, instructing you to enable the sensor in the setup:
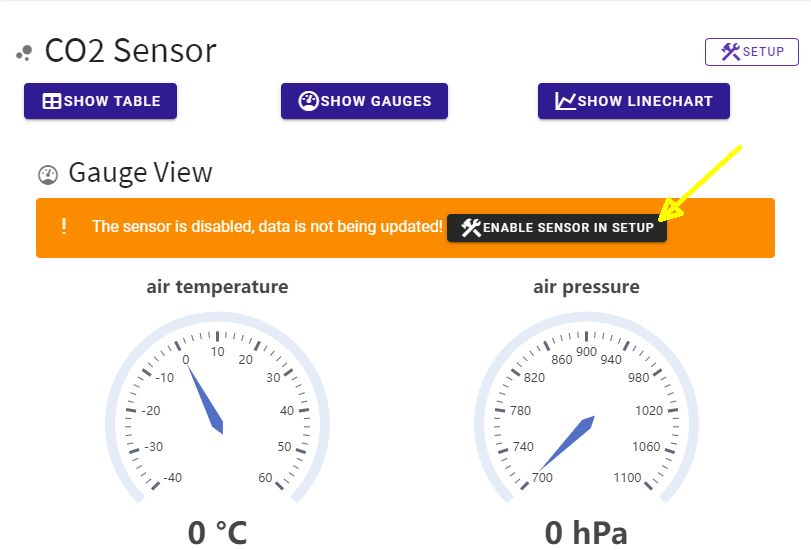
Click on the “Enable Sensor in Setup” button. (Later you can always use the Setup button to return to the screen).
In the Setup screen, click on the “enable Sensor” switch to enable the sensor. A line below will update when data is received and will display in green (and if there are errors or no data is being received it will be red).
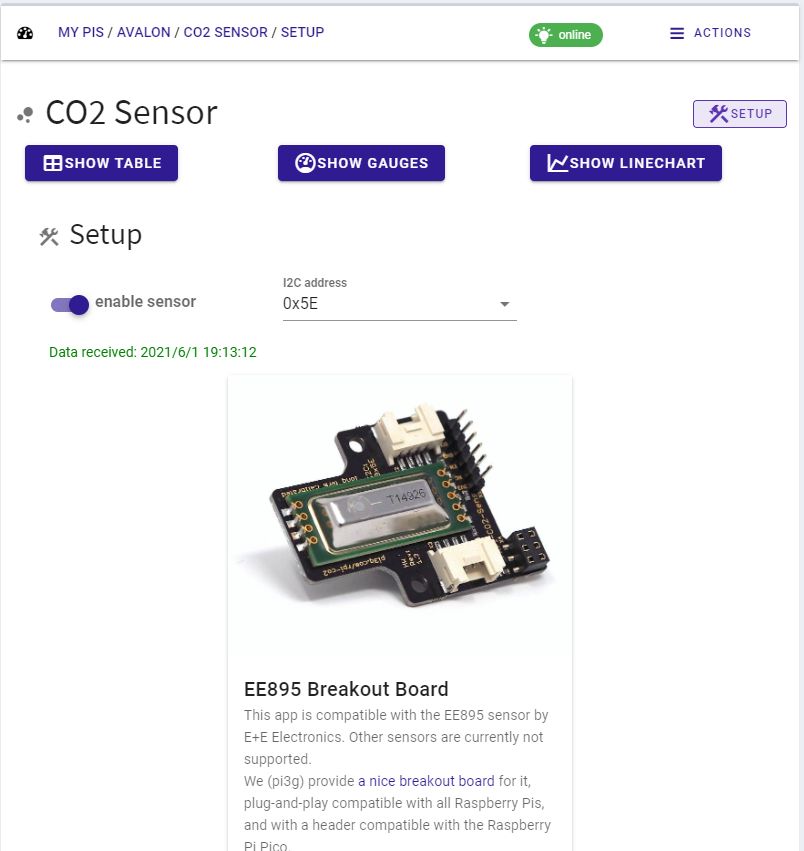
Tip: if you don’t have the sensor yet, you can purchase it from one of our resellers. Also please get in touch, if you are interested in reselling the sensor board.
Now you can click on one of the buttons (Show Table / Show Gauges / Show Linechart) to bring up the different data views which you have for the sensor data. Of course, all views will update live with new measurements. (The sensor data is updated every 15 seconds, so expect changes about every 15 seconds).
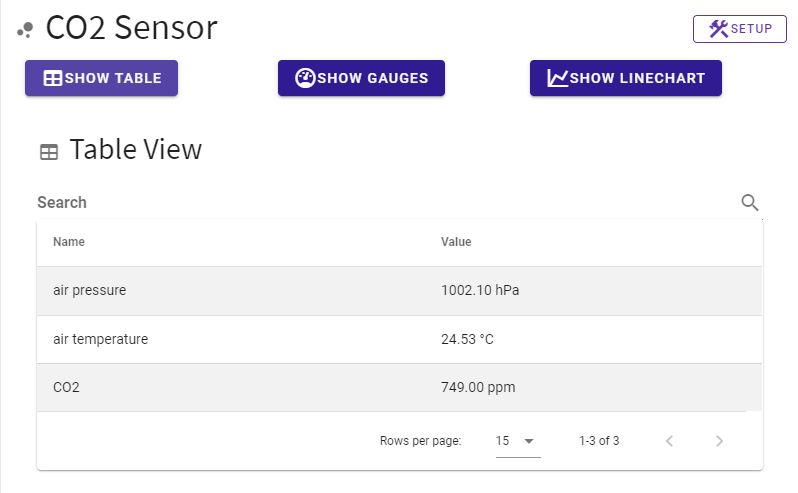
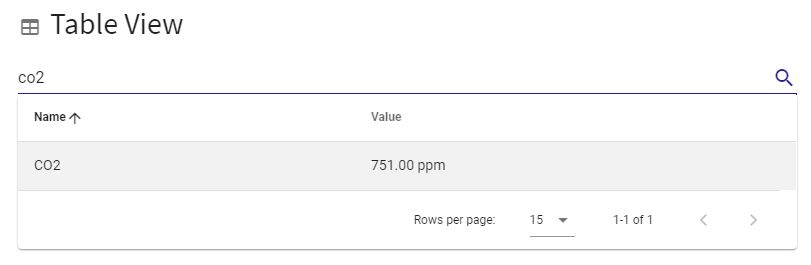
The table view provides the measured data (in the case of the CO2 sensor: air pressure, air temperature, CO2) in a nice tabular output. You can use the search feature to narrow down to just the item(s) you are interested in:
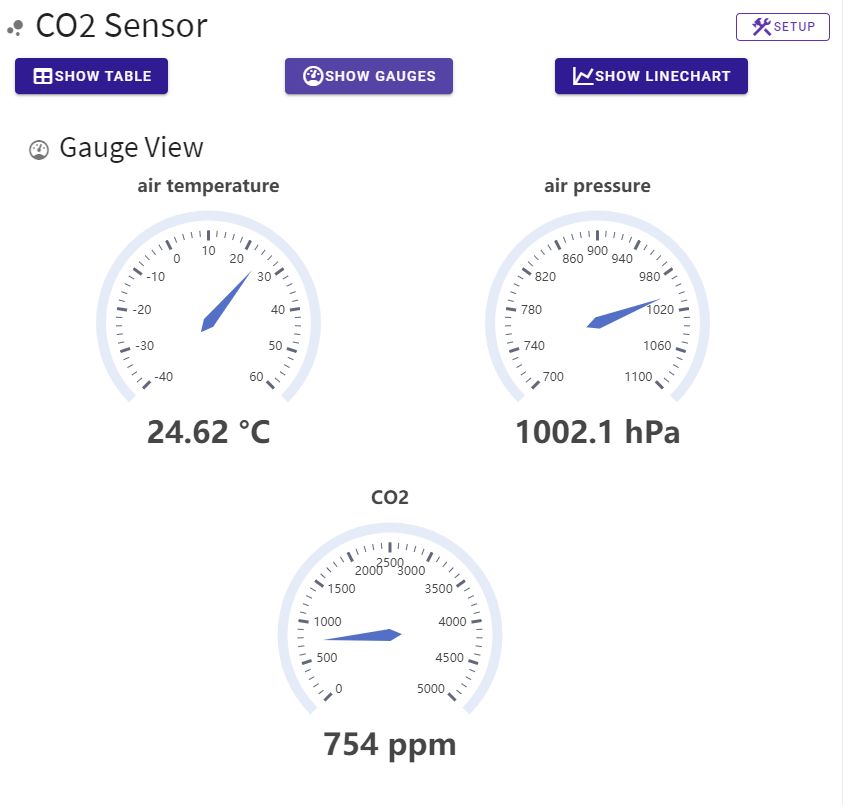
You’ve already seen the gauge view, which will show beautiful gauges with silky smooth animation:
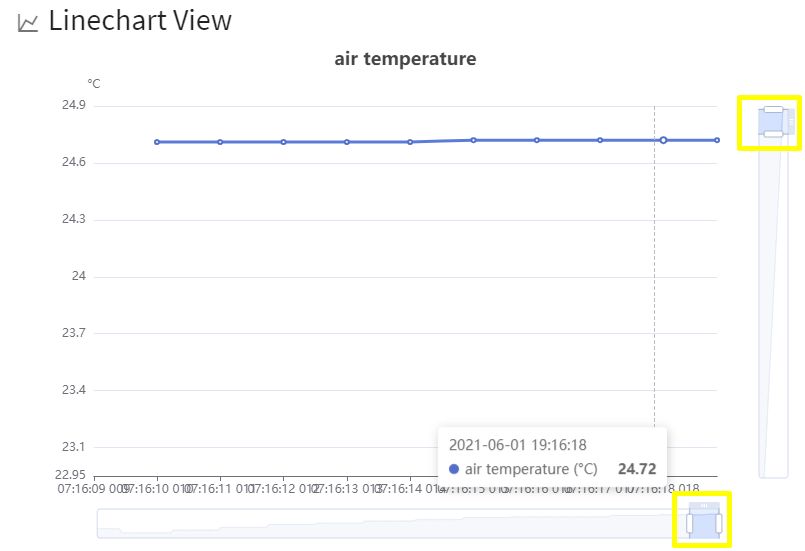
And of course, if you want to track the development fo CO2 / air temperature / air pressure over time, you can use our linechart view:
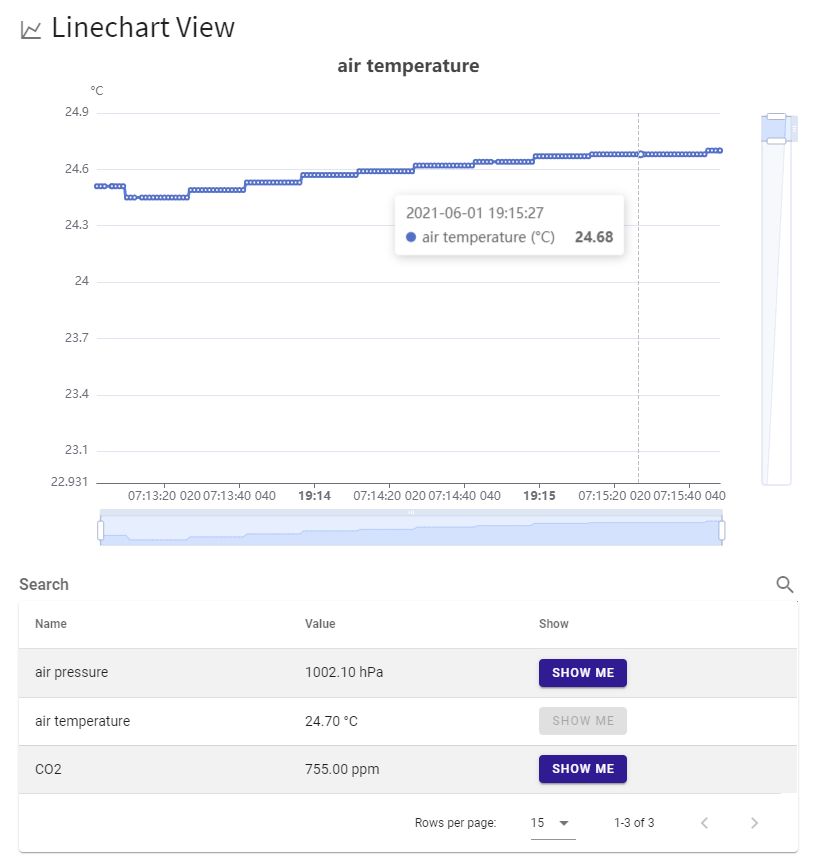
Click on the buttons (“show me”) to switch between the three measurands.
Mouse over the chart area to see the measurement value at the respective point in time.
Use the filters on the bottom and right side of the screen to narrow the view down to just the area of interest for you (in time and data values):
I hope you enjoyed this sneak preview, looking forward to your feedback upon release of the new PiCockpit version and the other new features!